
Life as a Perpetual Venn Diagram
By Shlomo Maital
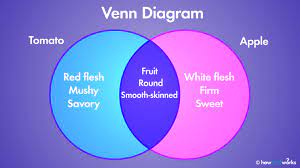
“A Venn diagram is a diagram that shows the logical relation between sets, popularized by John Venn (1834–1923) in the 1880s. The diagrams illustrate simple set relationships in probability, logic, statistics, linguistics and computer science.” (Wikipedia). (See diagram).
In its simplest form, it is two circles, representing two people or things or data sets, and the intersection shows common elements.
In a way, I sort of live my life as an active Venn diagram. Here is how.
We are blessed with a great many grandchildren, with varied personalities, interests and beliefs. As a retired but active professor, I encounter a great many people, hosting visitors to Technion. In all these interactions, my goal is to make contact. (“ET – phone home!”).
But how? Sometimes, a daunting task for an 80-year-old great grandfather, trying to ignite the interest of a four-year-old.
Venn diagrams help a lot.
Find the intersection. What do I know that my counterpart finds of interest?
And using the First Principle of Creativity: There is ALWAYS an intersection, common ground. Always. You just have to find it. Sometimes, it takes a bit of work. Watch the eyes, they light up when you find it. Two people who live and breathe have something in common.
Ask questions. Sometimes you strike paydirt with a question. Finding the intersection of the two circles requires finding the nature and extent of your counterpart’s circle (assuming you know your own). You need to know both. So explore theirs with questions.
Tomatoes and apples? Common ground? Well – they’re both fruits. Really.
Common ground between me and a four-year-old? Lego, animals, and ice cream. The latter, preferably with chopped up Oreo cookies.

1 comment
Comments feed for this article
July 16, 2023 at 1:08 pm
Juan Garfunkel
Amen