
If the US Economy is So Good – Why Is It Perceived as Bad?
By Shlomo Maital
Many experts – and Democrat strategists – fretted, worried, puzzled, pontificated and blustered over why the US economy did so well, by the numbers, and was perceived as so bad by working people.
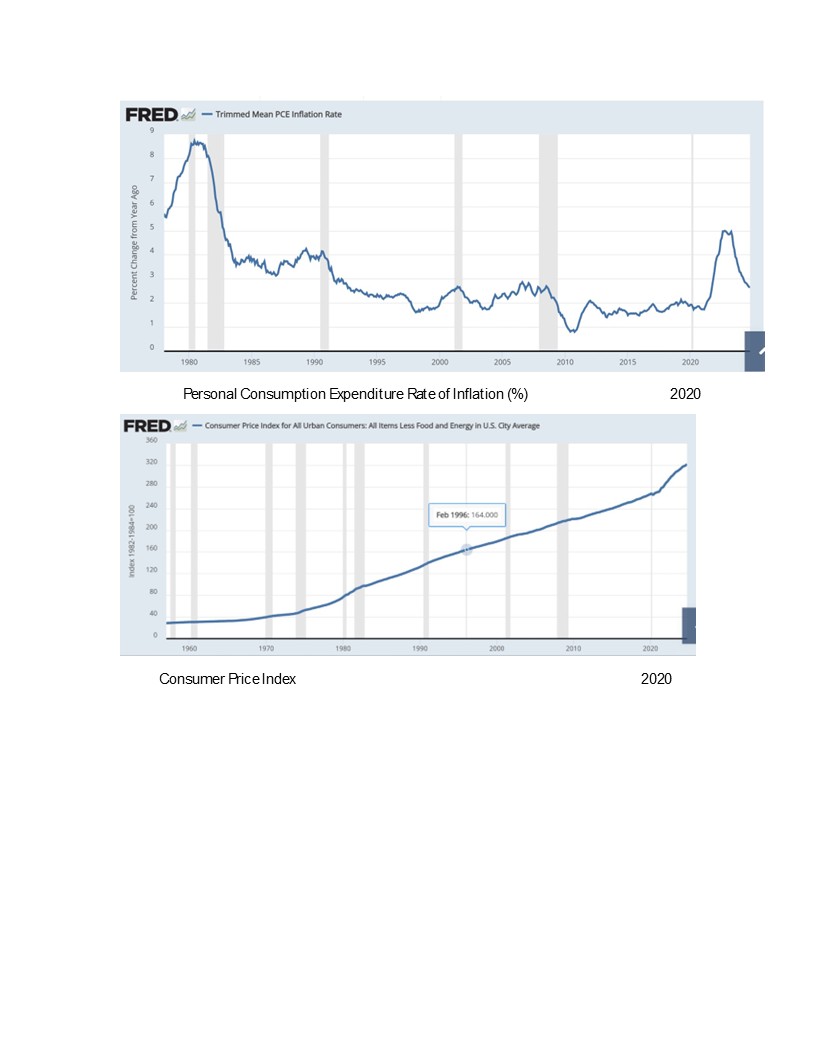
The above two graphs, thanks to the St. Louis Fed’s superb software “FRED”, provides an explanation.
In 2020 inflation (measured by the year to year percentage change in the personal consumption expenditure price index, which measures the price of what people buy) peaked at over 4% — and then fell sharply to around 2 per cent, leading the Fed to slash interest rates. See the top graph.
Good news, right?
In October 2024, just before the US Presidential election, the consumer price index was 321.7, up from April 2020’s level of 265.7. That is an increase of 21.7%. That means – what people bought just before the election was 21.7% more expensive than in April 2020, just before Biden won the election. During that time, the wages of low-income working people did not come close to rising by 21.7%. That means, a lot of people were struggling in 2024 to buy what they bought relatively easily in 2020. See the bottom graph.
The difference is simply this: Some measure inflation by the rate of change But ordinary people measure it by what they can buy at the supermarket. Good work for bringing down the rate of inflation! But – did you fix the damage the inflation did before you got it under control? Raised the national minimum wage to $15? No? Then – you will lose the election.


Leave a comment
Comments feed for this article