
Divided America: In Pictures *
By Shlomo Maital

How divided is the United States politically? An interesting graphic from the Washington Post tells the story.
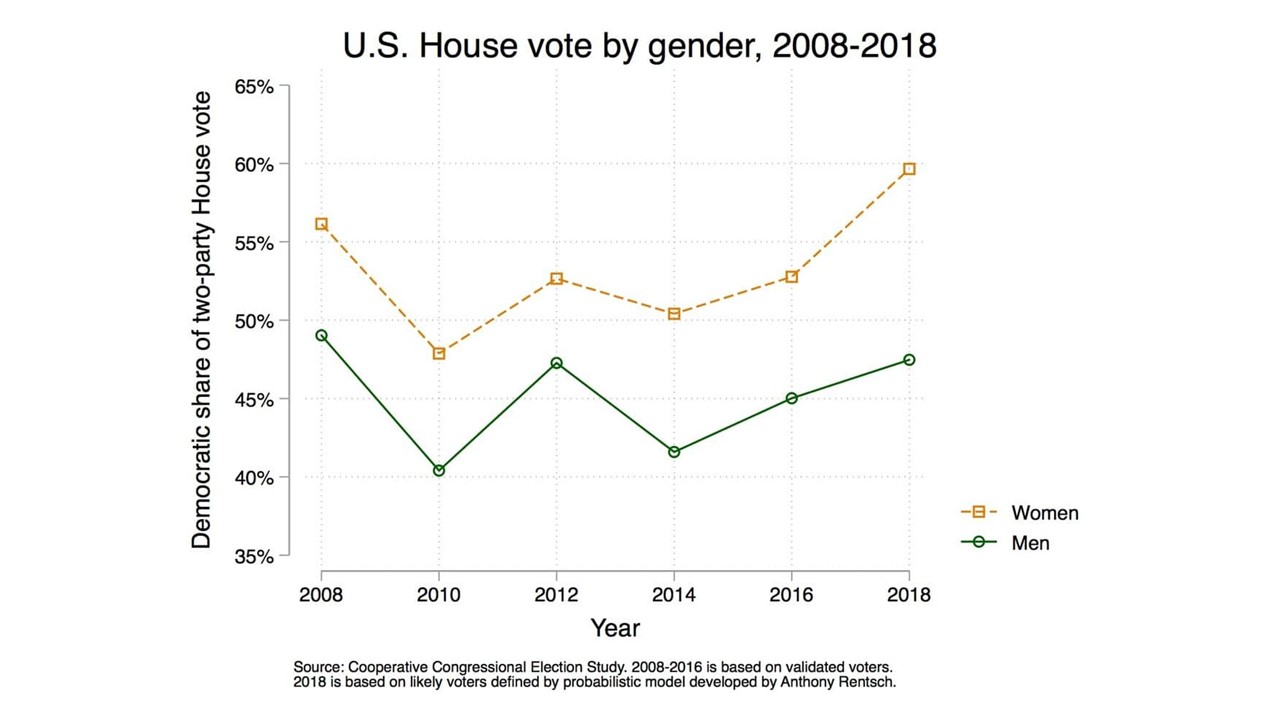
Top figure: % voting Democrat, mid-term (Nov 6) House of Representatives, by gender. Women: 66% (2/3). Men: 50% (1 in 2). Huge difference.
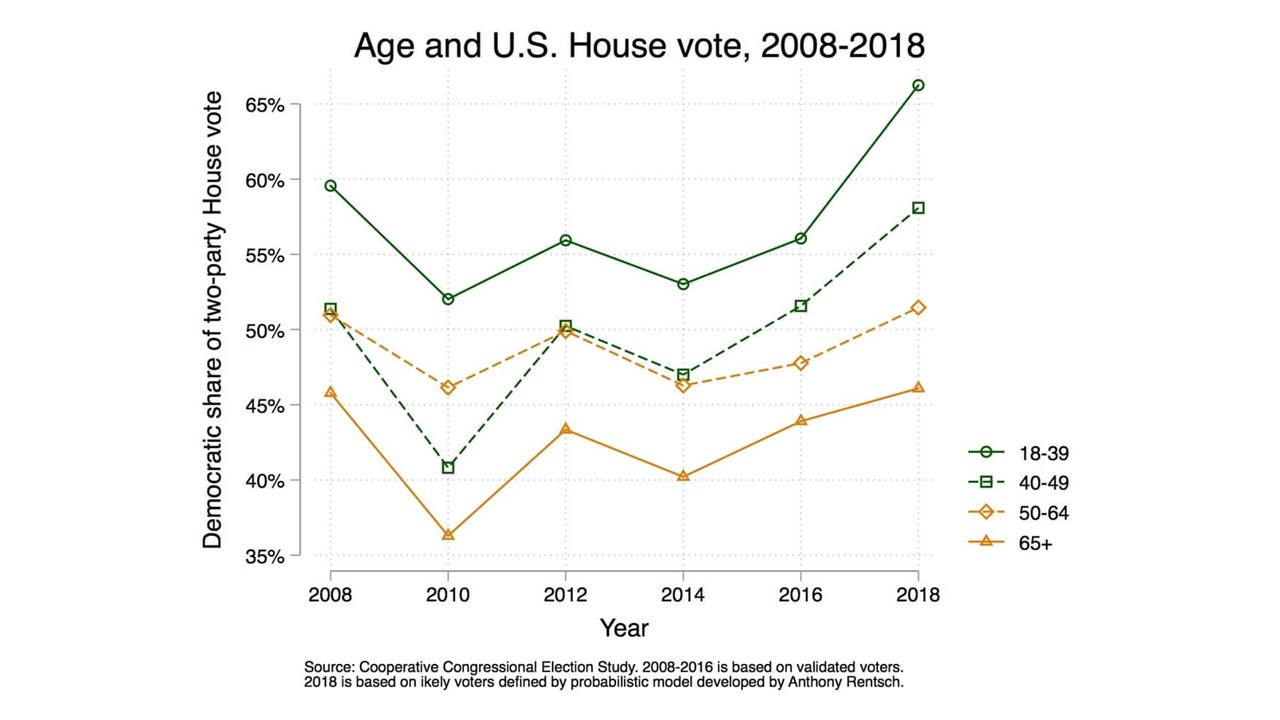
Middle figure: % voting Democrat, by age. Young (18-39) 66%. (2/3). 65 and older: 45% (less than 1 in 2).
Bottom figure: % voting Democrat, by education (white people). College women: 66% (2/3). College men: 50%. Non-college men: 37%.
Other graphs will tell the same story: East Coast/West Coast vs. Heartland (Middle states). North vs. South. City vs. Rural.
A New York Times headline summed up the election: Election confirms America’s divisions.
A close study of the 3 graphs shows: The divisions have been there since 2008 – but in 2018, they have grown substantially.
Not all of this divisiveness and anger can be blamed on Trump. Some comes from the fact that a few have grown wealthy, many have grown poorer. This deep economic division was ignored – and America will now pay the price.
* Source: Washington Post, Brian F. Schaffner, Nov. 10. “….these charts are based on data from the Cooperative Congressional Election Study (CCES), a large-scale academic survey conducted in every election year since 2008. For the 2018 CCES analysis, we used pre-election interviews with respondents weighted to be nationally representative of the adult population. We then applied a likely voter model trained on previous election cycles to create estimates for the 2018 electorate.”


Leave a comment
Comments feed for this article