
Unpacking the COVID-19 Stats: Four Measures
By Shlomo Maital

The COVID-19 statistics can be very confusing, and the press has not been great at dispelling the fog. Here is how the New York Times explains the four key measures:
- By Nate Cohn, Josh Katz, Margot Sanger-Katz and Kevin Quealy March 27, 2020
- 1. Cases per 1,000 people. This is a measure of the prevalence of coronavirus in the community. Confirmed Cases per 1,000 residents. An imperfect measure, because of spotty testing – are there few cases because of limited testing, or few cases because testing has shown this to be true? Hard to know.
- Confirmed cases per 1,000 by metro area
- New York City, at 2.15, is just below #1, Wuhan, China, 4.59, and Lombardy Region, Italy, 3.48, but Albany Ga. And New Orleans are surprisingly high, too, as ‘hot spots’, at 1.35, and 1.32, respectively.
- * HOW WIDESPREAD IS THE CORONAVIRUS IN THE COMMUNITY OR CITY?
- Each measure answers a different question.
| METRO AREA | POPULATION | CASES | PER THOUSAND |
| Wuhan, China | 11.1 mil. | 50,821 | 4.59 |
| Lombardy region, Italy | 10 mil. | 34,889 | 3.48 |
| New York | 20 mil. | 43,016 | 2.15 |
*HOW DEADLY IS THE VIRUS? WHAT IS THE DEATH RATE?
- Deaths per 1,000 people. This measure is likely to be more accurate, alas, than other measures. But this measure lags the number of infections by several weeks…
Deaths per capita are currently higher in the New York City area than in most other places.
| METRO AREA | POPULATION | DEATHS | PER THOUSAND |
| Lombardy region, Italy | 10 mil. | 4,861 | 0.48 |
| Wuhan, China | 11.1 mil. | 2,535 | 0.23 |
| Albany, Ga. | 153,000 | 10 | 0.07 |
| New Orleans | 1.3 mil. | 65 | 0.05 |
| Seattle | 3.9 mil. | 133 | 0.03 |
| Burlington, Vt. | 221,000 | 6 | 0.03 |
| New York | 20 mil. | 500 | 0.03 |
HOW FAST IS THE CORONAVIRUS SPREADING?
- Growth Rates Over Time.
Measure: the rate of cumulative cases over time, averaged over the previous week. This helps us learn, is the epidemic getting better or worse? Are we at the ‘apex’ (worst is behind us) or before it?
A growth rate of 40 percent on this chart means the cumulative number of cases is growing by 40 percent every day. A rate of 100 percent would mean that the number of cases was doubling daily.

March 1 March 8 March 22
HOW WELL HAS THE COMMUNITY OR CITY DONE, IN SLOWING DONE THE RATE AT WHICH THE CORONAVIRUS IS GROWING?
- Growth Rates by Case Count.
This measure is the rate of growth of the number of cases in a given place – it measures whether a community has slowed the rate of growth, before there is many cases. I.e., is the community flattening the curve?
Seattle and San Francisco succeeded in flattening the curve. How come? These measures help us ask the right questions
AVERAGE DAILY CHANGE IN TOTAL CASES, OVER THE PREVIOUS 7 DAYS
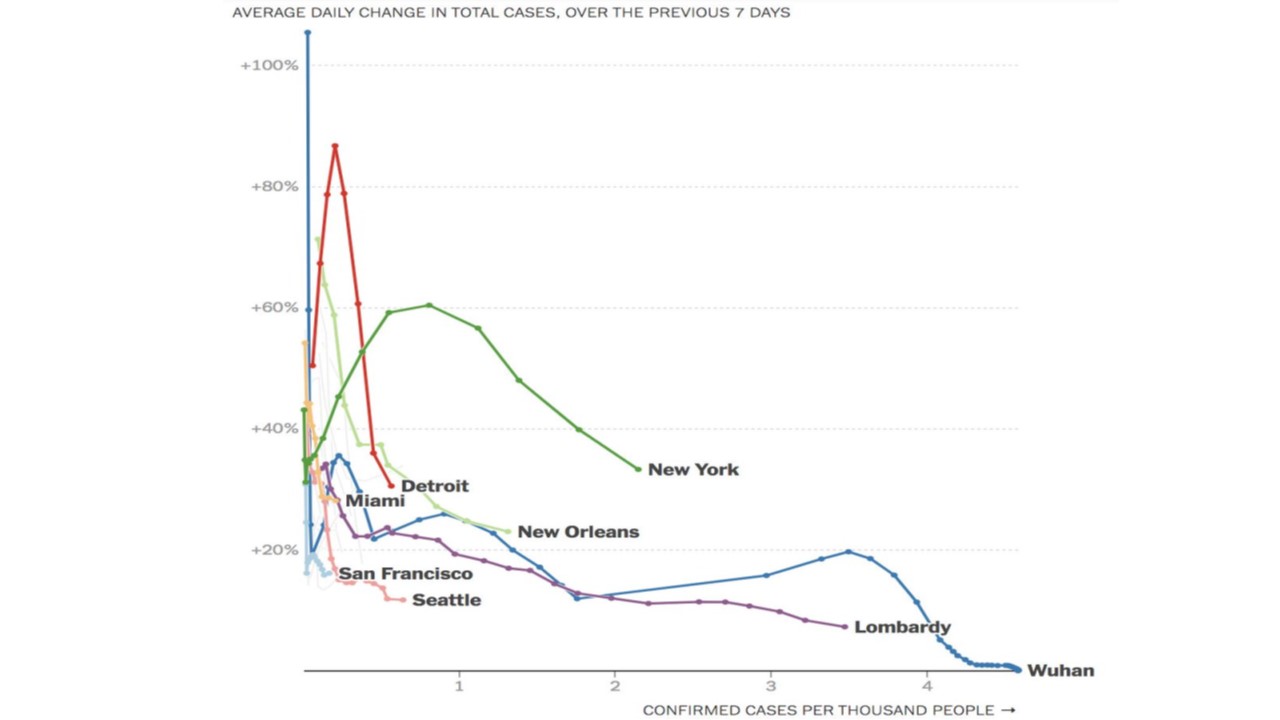
CONFIRMED CASES PER THOUSAND PEOPLE
= = = = = =
We need to be cautious when interpreting coronavirus statistics. And a wide variety of stats are being tossed at us, often by those who do not fully understand them.


Leave a comment
Comments feed for this article