
COVID-19: Logarithms Hold the Key
By Shlomo Maital

Warning: This blog could be harmful to your health…because it’s about… logarithms. (Logs). And plague. What in the world?
Well, let’s give it a shot. Nothing to lose.
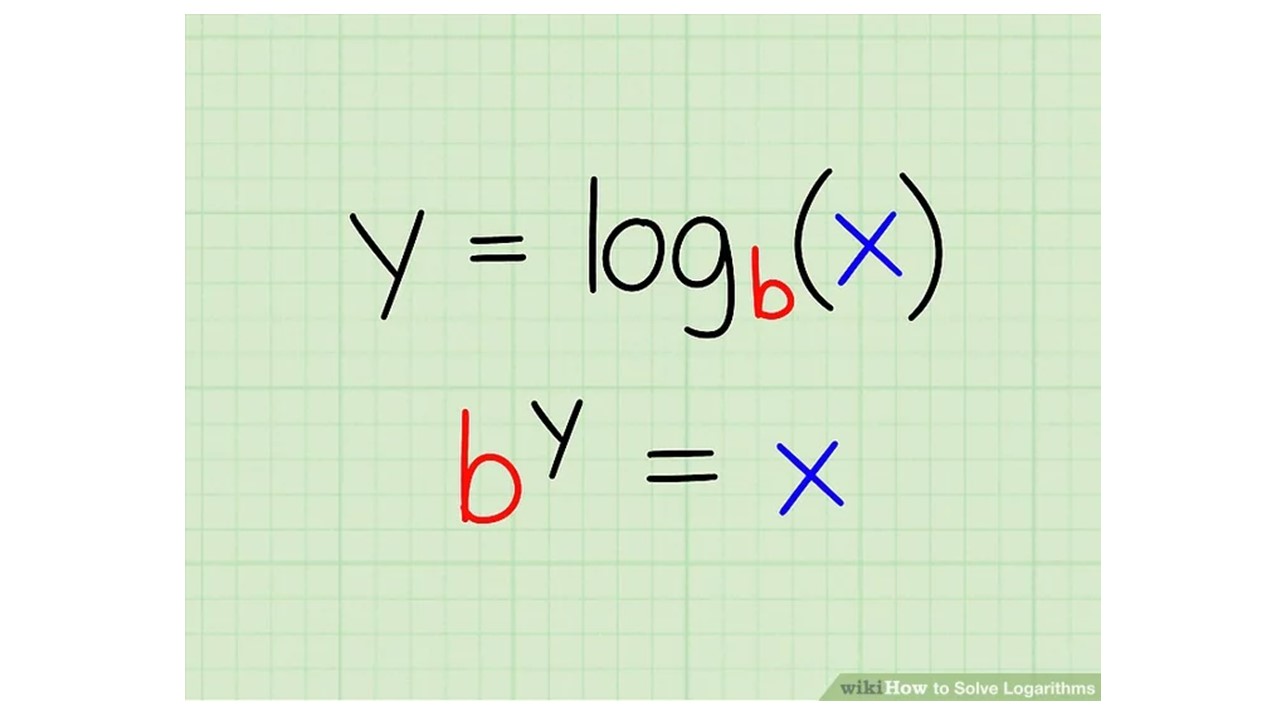
A logarithm is a number, such that when its ‘base’ (usually, the number ten, or the number ‘e’, 2.71828 (we do NOT have to go into the black depths of THAT number), is raised to the value of the log, you get the value of your starting number, x.
For instance, 102 = 100. So the logarithm of 100 (using the ‘base’ of 10) is 2.
Clear?
Why are logarithms useful? Well, they have fallen into massive disuse lately, because of computers and calculators. But once they were crucial. Because, suppose you need to multiply two big numbers. On paper. Ouch! But wait! If you knew the logarithms of the two numbers? Add them! Because? The value of by times bz equals bz+y — so, we have converted multiplying (hard!) to addition (easy!).
Logarithms was publicly proposed by John Napier in 1614, an English mathematician. Generations of school children (like my mother) had to learn the secrets of logs.
But what has this to do with COVID-19. So – there is a wonderful magical property of logs. Suppose there is a key number that you are tracking. E.g., the number of people in your country or your city or community, who have COVID-19. You can graph it, look at it, inspect the curve, it is rising, OK, but – what does it mean?
So here is what John Napier would recommend, 400 years ago. Take the logarithm of the number. Graph THAT, not the number itself.
Why? Because – trust me on this — the gradient, (steepness, or slope) of the logarithm graph tells everything. If the slope of the log is RISING, then the RATE of increase is increasing. If the slope is getting less steep, FALLING, the rate of increase of COVID-19 is declining. And this is crucial, to know how we’re doing. And you CANNOT tell this is you graph the number itself.
So, here in Israel, the slope of the logarithm of the number infected with COVID-19 has been declining. Yay! The rate of increase is declining. We’re getting toward the apex. It’s a ways off…but once we reach the top of THAT hill, the slope of the log will turn from positive to negative…and that’s a KEY point. Because that’s when the number infected begins to fall….cause of celebration.
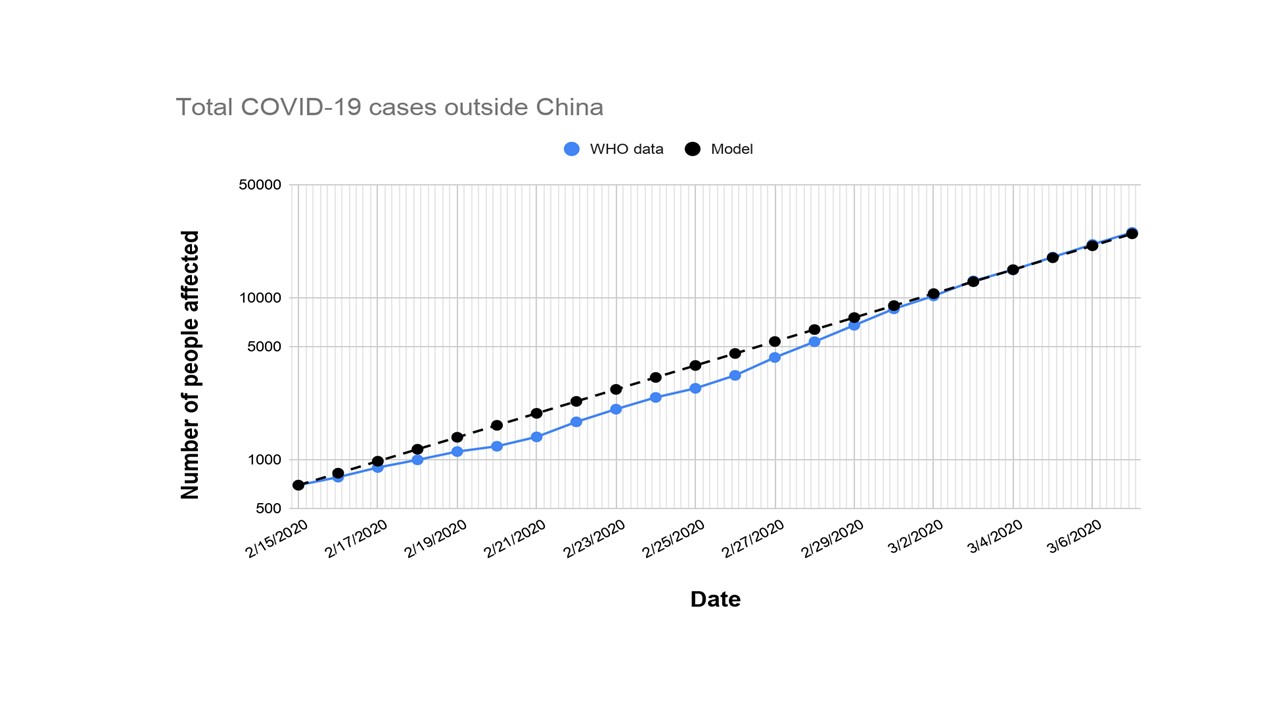
Clear? Clear as mud? So here is a sample graph. This is the total number of cases outside China. On a log scale. You can see a constant slope – constant rate of growth, as the virus spreads. Reflecting, maybe, a very slow response in Europe and the US.
So – in your country or city, track the logarithm of the number of cases, and measure the slope. That tells you whether it is speeding up or slowing down. I don’t think our political leaders are quite up to that difficult mental exercise.


Leave a comment
Comments feed for this article